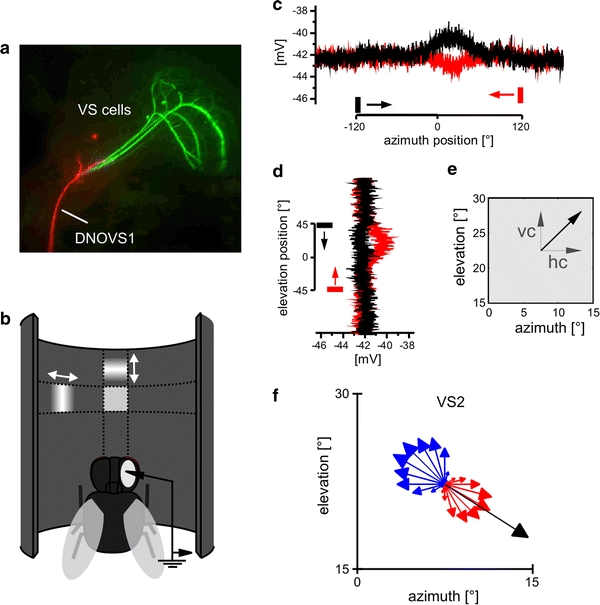
Fig. 1.

Determination of the local motion properties. a Cells of interest: three VS cells (green) and one DNOVS1 cell (red) were recorded and filled with fluorescent dyes. b Schematic of the procedure used for mapping the receptive field of a cell: a small bar (15° width) was moved first horizontally and then vertically while recording from the cell. c Example response of DNOVS1 to left- and rightward motion (black and red, respectively) at 22.5° elevation. d Example responses of DNOVS1 to a downward (black) and upward (red) moving bar at 7.5° azimuth. e From the horizontal and vertical component (hc and vc, respectively), a vector (black arrow) was calculated. The orientation of the arrow indicates the local preferred direction, the length of the arrow the local motion sensitivity at this point. f Local motion properties of VS2 to a sine grating moving in 24 directions as indicated by the arrows at 22.5° azimuth position and 22.5° elevation position. The length of the arrow represents the response strength, red represents a depolarization of the cell and blue a hyperpolarization of the cell. The black arrow is the vector summation of the vertical and horizontal component (color figure online)
