
Fig. 4.
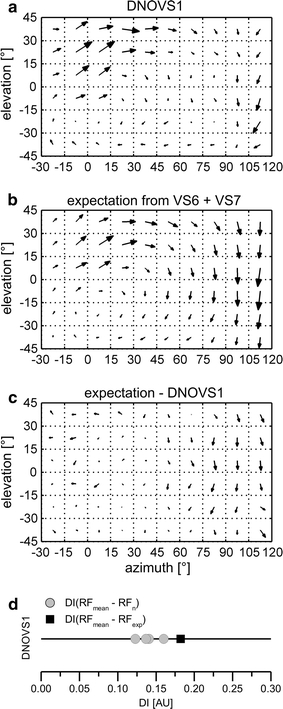
Receptive field map of DNOVS1. a Receptive field of DNOVS1. b Expected receptive field for DNOVS1, calculated by a summation of the receptive fields of VS6 and VS7 (Fig. 2), strongest coupled to DNOVS1 (Haag et al. 2007). c Difference between the receptive field of DNOVS1 and the expected receptive field. d DIs between the average receptive field (RF mean) and each measured receptive field (RF n) of DNOVS1 (gray dots) and the DI between the average receptive field (RF mean) and the expected receptive field (RF exp) marked with a black square. Data represent the mean responses recorded from n = 4 DNOVS1 cells