Fig. 6.

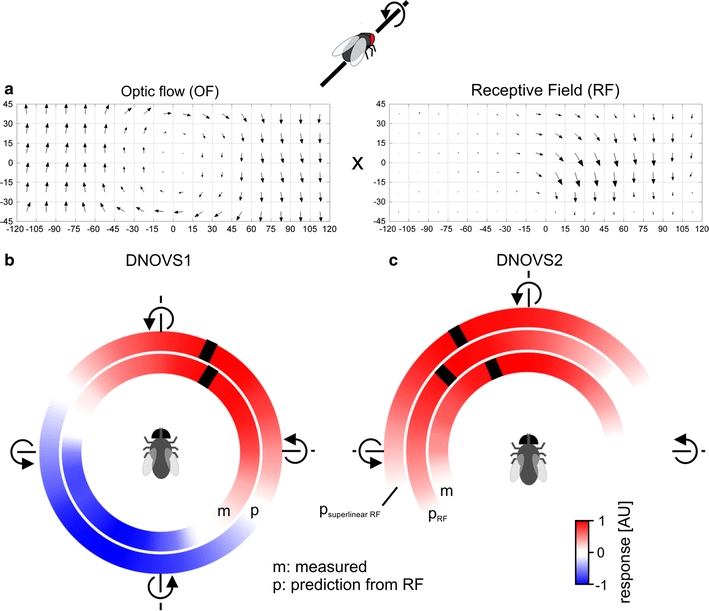
Global motion preferences from the receptive field. a Schematic of the procedure used to calculate the linear ego-motion prediction: for each movement (e.g. a counterclockwise roll movement) the optic flow (OF) was calculated and multiplied with the receptive field (RF) of a cell (see “Materials and methods”). b Measured response of DNOVS1 to 36 axis of rotation (inner circle) and the predicted sensitivity from the receptive field of DNOVS1 to 36 axes of rotations (outer circle) are shown color-coded. Red represents a depolarization or a strong similarity between the receptive field and the optic flow and blue a hyperpolarization or a contradiction for the predicted sensitivities. c Measured and predicted sensitivities of DNOVS2. For the measured responses, red represents an increase of the spike frequency of DNOVS2. Predicted sensitivities were calculated from the receptive field of DNOVS2 (p RF) and from the superlinear receptive field of DNOVS2 (p superlinearRF). p superlinearRF yields a better match to the measured response of DNOVS2 than p RF (color figure online)
