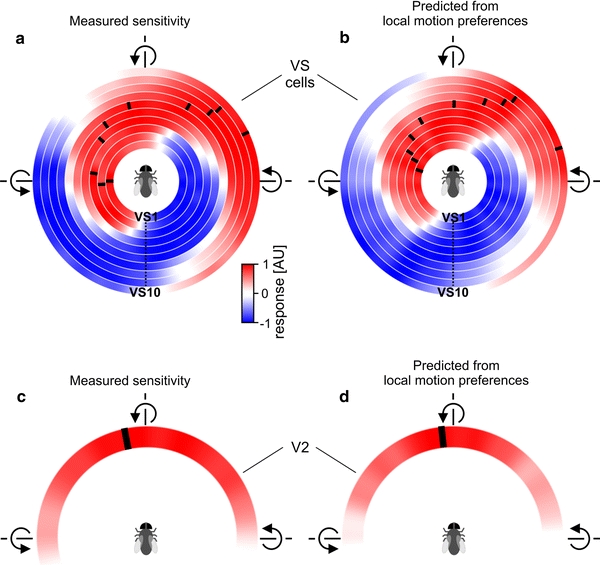
Fig. 8.

Prediction of global motion preferences for VS cells and V2. Mean responses of ten VS cells (a) and V2 (b) to 36 axes of rotation shown in a color-coded way. Red represents a depolarization or an increase of the firing frequency for V2 and blue a hyperpolarization. The preferred axis of rotation (black ticks) shifts along the azimuth with increasing VS cell number. Data are from Wertz et al. (2009). c, d Sensitivities as predicted from the receptive fields of VS cells and the V2 cell. The predictions fit the measured responses rather well for most VS cells and V2 (color figure online)
