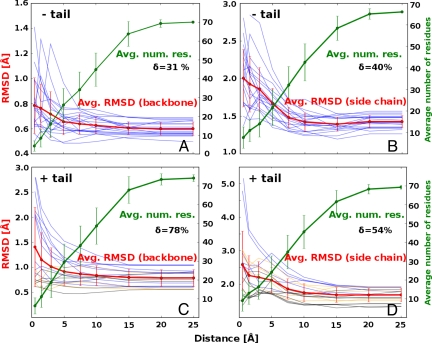
Fig. 2.
Induced fit in ubiquitin binding as a function of distance from the binding site. Local structural differences between the conformationally selected unbound structures and the corresponding bound structures of ubiquitin, captured as the average atomic rmsd values, and given as a function of distance from the binding site without the C-terminal tail [backbone (A) and side chains (B)] or with the C-terminal tail [backbone (C) and side chains (D) included]. The red curve represents the mean rmsd values calculated from all 19 pairs of structures, the blue curves represent the individual structural pairs, and the green curve represents the average number of residues in each distance range. The δ parameter, defined as δ = (rmsd0.5Å − rmsd25Å)/rmsd25Å) × 100%, captures the extent to which local conformational deviations close to the binding site (0.5 Å range) are greater than the global deviations (25-Å range). We use colors to illustrate the extent to which the residues in the C-terminal tail take part in forming the binding site: blue, more than ¼ of all of the tail residues are in the binding site (from 25% to 100%); yellow, <25% of tail residues are in the binding site; black, tail does not take part in the binding interaction. All error bars denote standard deviation of a given variable.

