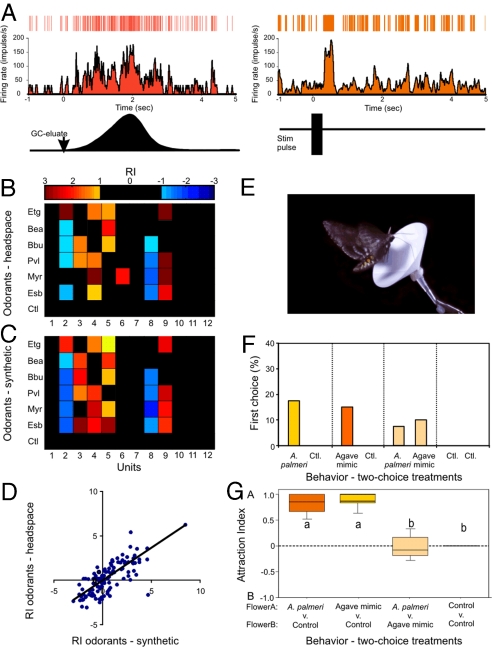
Fig. 3.
Comparison between active GC-fractionated odorants from A. palmeri flowers and equivalent synthetic compounds. (A) Poststimulus time histograms and raster plots of a unit that showed significant responses (based on CUMSUM test; see SI Text) to both floral headspace and synthetic ethyl sorbate. Lower plots (in black) are the GC peak of the compound (Left) and the synthetic stimulus pulse (Right). The arrow on the GC peak indicates stimulus onset. A 200-ms stimulus pulse of synthetic ethyl sorbate, at a concentration equal to that in the GC eluate, led to a brief increase in spiking rate that closely followed the stimulus duration. (B and C) Responses of one 12-unit ensemble to headspace (B) and synthetic (C) floral odorants, plotted as color-coded response matrices across all units (columns 1–12) and odorants (rows). Tested odorants were those evoking the strongest ensemble responses: Etg, Bea, Bbu, Pvl, Myr, and Esb. In addition, odorless mineral oil was tested as a negative control (Ctl). Excitatory (RI ≥1.0 SD) or inhibitory (RI ≤ −1.0 SD) responses are shown; for clarity, weak or null responses are not shown. (D) Relationship between unit responses (all preparations, n = 6) to synthetic vs. headspace odorants. Only units that elicited a significant response (excitatory, RI ≥2.0; inhibitory, RI ≤2.0) to one of the six odorants are shown. Also plotted are the responses of those units to the other odorants. There was a significant correlation between unit responses to synthetic and headspace odorants (solid line; mixed effects regression: P < 0.001). (E and F) Behavioral two-choice wind-tunnel tests examining upwind flight and feeding behaviors of moths to paper flowers (E) emitting the synthetic mixture of odorants determined through GC-MR and the natural floral scent composed of ≈60 odorants. The percentages of moths feeding from paper-flower treatments in two-choice tests are presented in F. Moths significantly chose paper flowers emitting the synthetic mixture and natural floral scent over the unscented control flowers (G test: P < 0.02), but when in the presence of both, moths did not distinguish between them (the A. palmeri mixture mimic and the natural bouquet) (G test: P = 0.99). (G) The attraction index between flower treatments in the two-choice tests. Box plots are the 25th and 75th percentile, error bars are the 5th and 95th percentile, and the horizontal line is the mean. Letters denote a significant difference between odor stimuli (two-tailed t-test: P < 0.05). n = 40 moths for each two-choice wind-tunnel experiment.

