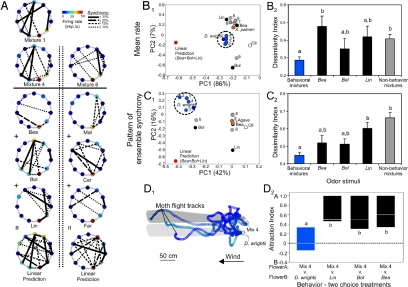
Fig. 4.
Determination of the neural representation of mixture discrimination and generalization and the contribution of single odorants to mixture processing and behavior. (A) Unit mean firing rate and the pattern of ensemble synchrony. The firing-rate response for the 11-unit ensemble is represented as a circular matrix in which individual units are ordered in a clockwise direction starting from the 12:00 position (neuron 1, N-1). Each unit is represented as a circle in the perimeter of the matrix, and its firing rate is represented by its color (see color scale). Also shown are the synchrony patterns (solid, dashed, and dotted lines connecting pairs of units) that underlie the ensemble response to each stimulus, where each connecting line represents the level of synchronous firing (after shuffle correction) of specific pairs. Ensemble responses to two behaviorally effective mixtures, mixture 1 (nine odorants) and mixture 4 (three odorants), a nonbehavioral mixture (mixture 6), the three single odorants of mixture 4 (Bea, Bol, and Lin), and the three single odorants of mixture 6 (Car, Far, and Mal). Also shown is the linear sum of the spatiotemporal responses to the single odorants (linear prediction). (B1 and B2) Multivariate analysis of the mean firing rate of ensembles to behaviorally effective and ineffective mixtures and single odorants. (B1) PCA of the ensemble (shown in A) mean firing rate responses to all of the mixtures and the single odorants Bea, Bol, and Lin. Blue circles correspond to behaviorally effective mixtures, gray to behaviorally ineffective mixtures, orange to A. palmeri, black to single odorants, and red to the linear sum of the single odorants making up mixture 4. Note the clustering of the behaviorally effective mixtures (denoted by dashed circle). (B2) Dissimilarity indices in the ensemble firing rates in response to mixture 4 and the other behaviorally effective mixtures (blue bar), the single odorant constituents of mixture 4 (Bea, Bol, and Lin; black bars), and behaviorally ineffective mixtures (gray bar) (n = 14 preparations). (C1 and C2) Multivariate analysis of the pattern of ensemble synchrony to behaviorally effective and ineffective mixtures and single odorants. (C1) PCA of the ensemble synchrony coefficients shown in A. Note the clustering of the behaviorally effective mixtures (blue circles, dashed circle) relative to the single odorants and behaviorally ineffective mixtures. (C2) Dissimilarity indices in the ensemble synchrony coefficients in response to mixture 4 and the other behaviorally effective and ineffective mixtures (blue and gray bars, respectively) and the single odorants of Mixture 4 (Bea, Bol, and Lin; black bars) (n = 14 preparations). (D1 and D2) Behavioral responses of moths to the behaviorally effective mixtures compared with the constituents. (D1) Three moth flight tracks to two floral odor sources; one emitting the D. wrightii scent and the other emitting mixture 4. Moths were tested individually, and the tracks of individual moths are represented by different shades of blue. The dimensions of the odor plume are represented by the gray shading. Circles correspond to 16-ms intervals. (D2) Behavioral attraction index of mixture 4 relative to the D. wrightii floral scent and the single odorants Bea, Bol, and Lin. Letters denote significant different between odor stimuli (P < 0.05).

