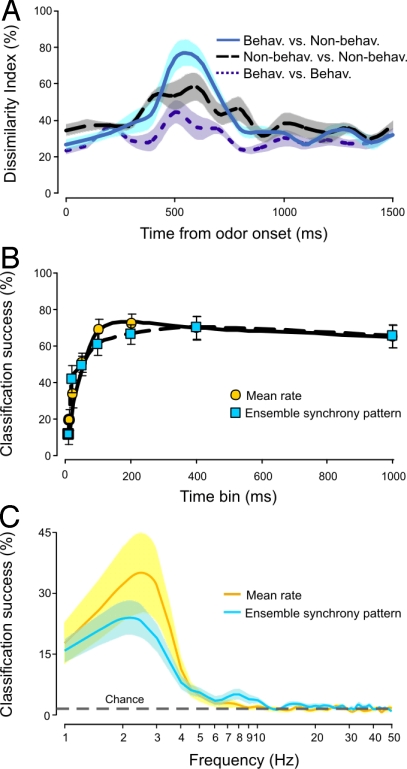
Fig. 5.
Classification success of ensemble responses to behaviorally effective and ineffective odors at varying timescales. (A) Dissimilarity indices (calculated from the mean firing-rate responses of the ensemble) between odor stimuli through time from odor onset (200-ms odor pulse at time = 0 ms) for one preparation. Dissimilarity indices between behaviorally effective and ineffective mixtures (light blue solid line), ineffective mixtures to one another (dashed black line), and effective mixtures to one another (dotted dark blue line) are shown. Shaded areas denote the ± SEM. (B) Mean classification success measured during response to odor when time-bin durations (10–1,000 ms) were varied for the pattern of ensemble synchrony (blue squares) and mean rate (orange circles). Symbols are means ± SEM for n = 11 moths. (C) Percentage of success for classifications based on Fourier analysis of the population activity at different time scales during a 1,000-ms interval (sampled at 100 Hz) after a 200-ms odor pulse. Mean rate (orange line) and the pattern of ensemble synchrony (blue line) were determined (shaded area denotes ± SEM; n = 11 moths).

