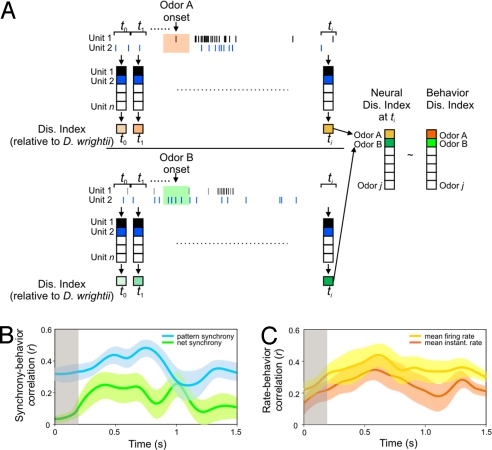
Fig. 6.
Ensemble population responses and correlation of neural codes with behavior. (A) Population-vector responses constructed from any time bin (t1 to ti) where the ith dimension corresponded to the mean firing rate, the mean instantaneous firing rate, the pattern of ensemble synchrony, or the net synchrony composed of unit 1 to unit n (rate codes), or unit-pair 1 to unit-pair n (synchrony codes). The resulting dissimilarity index of each odor stimulus (OdorA to Odorj) relative to D. wrightii ensemble responses was then correlated with the dissimilarity indices of the behavioral response to the mixture stimuli (OdorA to Odorj). (B) Correlation of behavior and synchrony codes through time (0–1,500 ms) for all preparations (n = 14). The blue line corresponds to the mean correlation for the pattern of ensemble synchrony and behavior, and the green line is for the net synchrony. (C) Correlation of behavior with the rate codes through time for all preparations (n = 14). The orange line is the mean correlation for the mean firing rate, and the red line marks the mean instantaneous rate. Shaded areas around the lines are ± SEM. The gray shaded areas denote the time course (200 ms) of the odor stimulation.

