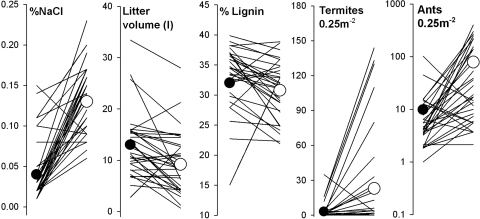
Fig. 1.
Effects of Na treatments on soil salinity, litter decomposition (volume and litter content), and the abundance of two common litter taxa in an Amazon forest. Lines from left to right denote differences between control and +NaCl treatment in 35 paired plots. Circles are treatment means: black = control (stream water), white = 0.5% NaCl solution made from stream water.

