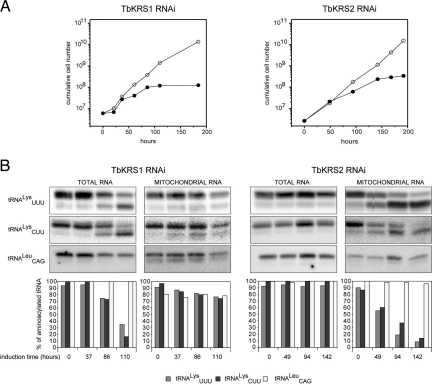
Fig. 2.
Effect of depletion of TbKRS1 and TbKRS2 by RNAi. (A) Effect of RNAi-mediated knockdown of TbKRS1 and TbKRS2 expression on T. brucei growth. Left panel shows the growth curve obtained for a representative clonal transgenic cell line in which TbKRS1 expression was repressed (●). As a control of the growth rate, uninduced cells from the same cell line (○) were grown in parallel. The panel on the right shows the growth curve of a representative clonal cell line in which TbKRS2 expression was repressed (●) in comparison to the uninduced cells. Induction of the interference started at time 0 h for both cell lines. (B) Effect of RNAi-mediated knockdown of TbKRS1 and TbKRS2 expression on tRNALys aminoacylation. Left panel shows TbKRS1 (Left) and TbKRS2 (Right) RNAi cell line Northern blots of total and mitochondrial RNA samples isolated and electrophoresed under acidic conditions. Time of induction is indicated at the bottom. The blots were probed for both tRNALys isoacceptors (CUU and UUU), as well as for a control tRNA (tRNACAGLeu). The bar graph shows the quantification of the results. Relative amounts of aminoacylated tRNAs are indicated for tRNAUUULys (light gray), tRNACUULys (dark gray), and tRNACAGLeu (white). For each lane, the sum of aminoacylated and deacylated RNA was set to 100%. Right panel shows the same information for the TbKRS2 RNAi cell line.

