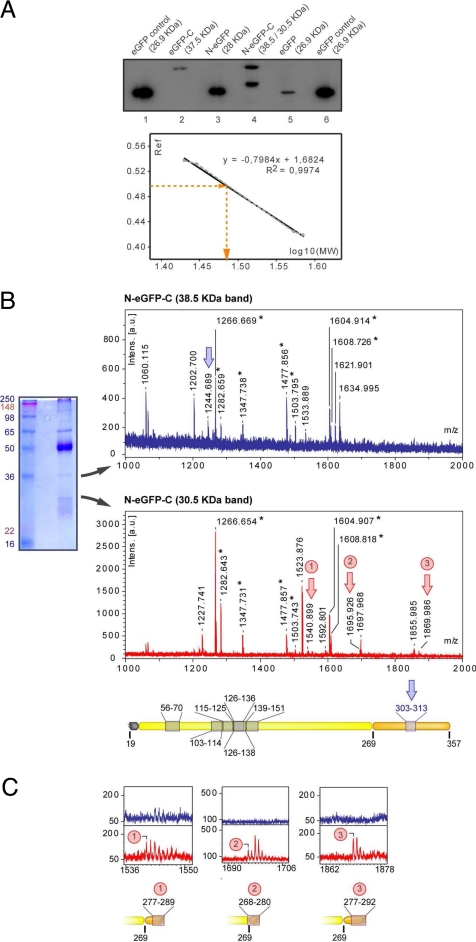
Fig. 5.
TbKRS2 processing. (A) Immunoblot analysis of eGFP fusion proteins expressing cell lines. Total protein fractions of 8.5 × 10⁶ cell equivalents of the different cell lines were electrophoresed on high resolution SDS/PAGE, transferred to a PVDF membrane and analyzed by immunoblot with α-GFP antibody. On the bottom, logarithm of known eGFP fusion proteins MW was plotted versus their relative mobility (Rf) to build a standard curve. Linear regression equation was used to determine the molecular weight of the lighter N-eGFP-C expressed product. (B) On the left, immunoprecipitation of N-eGFP-C expressing cell line with α-GFP. On the right, mass spectra obtained for the 38.5-kDa (top) and 30.5-kDa (bottom) immunoprecipitated proteins. The asterisk indicates the mass peaks that matched with the protein sequence. Blue and red arrows indicate mass peaks specific for 38.5- and 30.5-kDa proteins respectively. A reproduction to scale of N-eGFP-C is shown on the bottom, indicating the peptide matches. (C) Magnified view of the mass spectra obtained for the two proteins is compared on m/z regions corresponding to the 30.5-kDa protein specific mass peaks.

