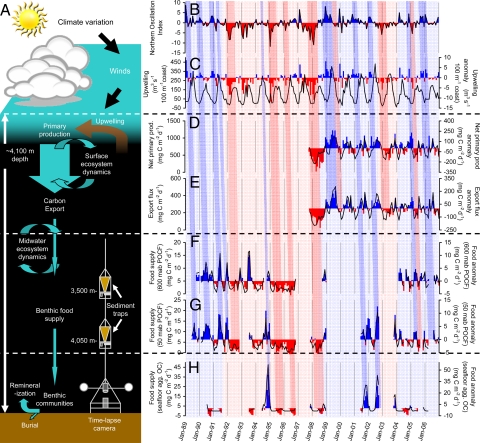
Fig. 2.
Schematic of processes and 18-year time series analyses (1989–2007) through the oceanic water column to the sea floor at the Northeast Pacific study site (Station M). (A) Schematic illustrating the simplified process by which climate can influence deep-sea ecology and biogeochemistry. (B) NOI (www.pfeg.noaa.gov/products/PFEL/modeled/indices/NOIX/noix.html), an indicator of El Niño-Southern Oscillation (ENSO) variation in the Northeast Pacific (70), is shown. Monthly data (black lines) and anomalies (positive in blue bars and negative in red bars) are from the Northeast Pacific. (C) Upwelling Index (71) for the California coastline in the vicinity of the Northeast Pacific study site (Station M). (D) Net primary production computed by using the carbon-based production model (72) applied to satellite data collected over monthly periods at a radius of 50 km around the study site. (E) Export flux calculated from net primary production and sea-surface temperature (73). (F and G) POCF to 600 m above bottom (mab) (3,500-m depth) (F) and 50 mab (4,050-m depth) (G). (H) Visibly detectable aggregate fluxes to the seafloor measured by using empirically calibrated time-lapse photography (21). Overlying the time series plots are light blue and light pink shading indicating time periods dominated by positive and negative NOI conditions, respectively. La Niña conditions are associated with the higher peaks in the NOI, as in early 1997 and late 1998, whereas El Niño conditions are associated with lower values of the NOI, as in early 1995 and early 1998. These conditions are then ultimately related to either higher than (light blue) or lower than average (light pink) food supplies. Darker blue and pink bars indicate similar associations on monthly time scales. The slant of the bars from the top to bottom panels is indicative of the time lags linking climate phenomena to seafloor processes.

