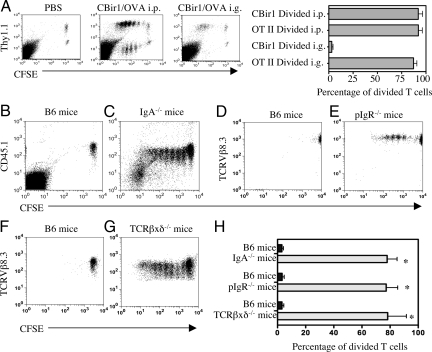
Fig. 1.
CBir1 Tg T cells proliferated in response to systemic stimulation, but not to mucosal stimulation with CBir1 flagellin in B6.WT mice (A). CFSE-labeled CD4+ T cells (1 × 10⁶) from Thy1.2. CBir1 Tg mice and 1 × 10⁶ CFSE-labeled CD4+ T cells from Thy1.1. OT-II mice were co-transferred into wild-type Thy1.2. B6 mice. The recipient mice were injected i.p. with 50 μg CBir1 and 100 μg OVA or gavaged with 100 μg CBir1 and 100 μg OVA the next day respectively. Spleen CD4+ T cell proliferation was analyzed 48 h later from the i.p. injected recipients and 72 h later from the gavaged recipient mice. The percentage of divided Thy1.1+ OT II T cells and Thy1.1− CBir1 Tg T cells was calculated by flow cytometry by gating on Thy1.1+ and Thy1.1− cells. *, P ≤ 0.01 compared to divided CBir1 Tg T cells in response to CBir1 flagellin given i.p. (B and C) CFSE-labeled CD45.1+ CBir1 Tg T cells (1 × 10⁶) were transferred into wild-type B6 or B6.IgA KO mice. (D and E) CFSE-labeled TCRVß8.3+ CBir1 Tg T cells (1 × 10⁶) were transferred into wild-type B6 or B6.pIgR KO mice. (F and G) CFSE-labeled TCRVß8.3+ CBir1 Tg T cells (1 × 10⁶) were transferred into wild-type B6 or and B6.TCRβ×δ KO mice. The recipient mice were gavaged with CBir1 the next day. Splenic CD4+ T cell proliferation was analyzed 72 h later. CFSE-CBir1 Tg T cells proliferated in response to gavaged CBir1 Flagellin in B6.IgA KO mice (C), B6.pIgR KO mice (E), and B6.TCRβxδ KO mice (G), but not in WT B6 mice (B, D, and F). Representative data of three experiments is shown. (H) The percentage of divided CBir1 Tg T cells from six recipient mice of each group was shown as mean ± SE. *, P ≤ 0.01 compared to divided cells in B6 recipients.

