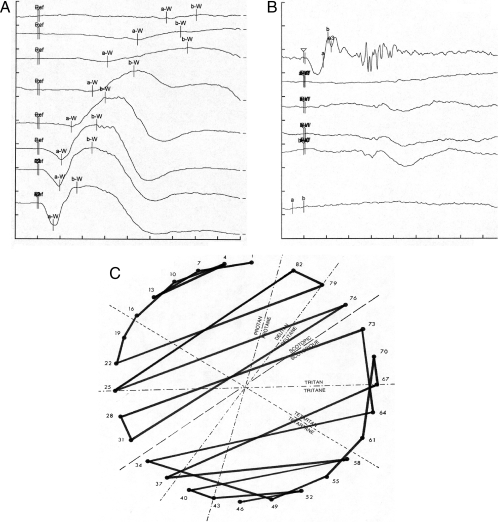
Fig. 6.
Clinical features of achromatopsia patients with PDE6C mutations. Ganzfeld ERG recordings under dark-adapted (A) and light-adapted (B) conditions. (A) Under scotopic conditions, the evoked responses were within the normal range. Only high intensity stimuli evoked responses within the lower normal range (series of stimuli with an intensity of 1, 2.5, 10, 100, 1,000, 2,500, and 10,000 mcds/m2 from top to bottom, respectively; x axis 20 ms/division; y axis 40 microvolt/division). (B) Oscillatory potentials (top row; x axis 20 ms/div.; y axis 100 microvolt/div.) and the recordings under photopic conditions revealed non-detectable responses to single (middle rows; x axis 20 ms/div.; y axis 100 microvolt/div.) and 30-Hz-Flicker stimuli (bottom: x axis 20 ms/div.; y axis 80 microvolt/div.). The responses were evoked by stimuli with an intensity of 2,500 mcd/m2, 200, 2,000, 2,500, 20,000, and 1,000 mcd/m2 from the top to the bottom, respectively. (C) Results of the FM 28 HUE color vision test with multiple permutations principally along the scotopic axis.

