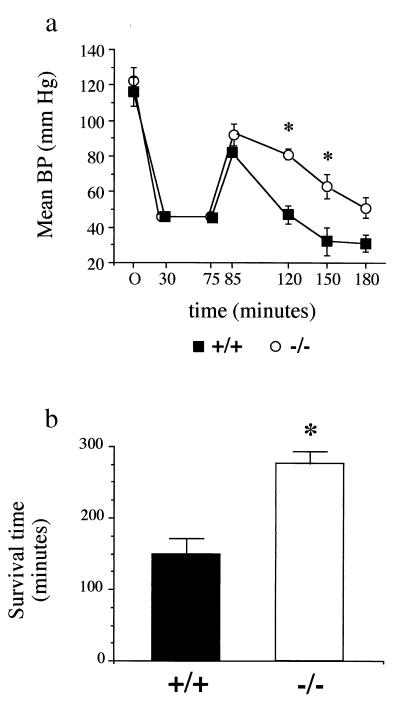
Figure 1.
Time course of mean BP (a) and mean survival time (b) in mice subjected to HS and resuscitation (Protocol 1). Mice (five PARP+/+ and five PARP−/−) were bled over 30 min to a mean BP of 45 mmHg. This mean BP was maintained for 45 min, followed by resuscitation with isotonic saline (administered over 10 min) at a volume of 2× the shed blood volume. Mice were then observed until death, and the overall survival time was recorded. Values are shown as means ± SEM. ∗, P < 0.05 PARP−/− vs. PARP+/+ mice.

