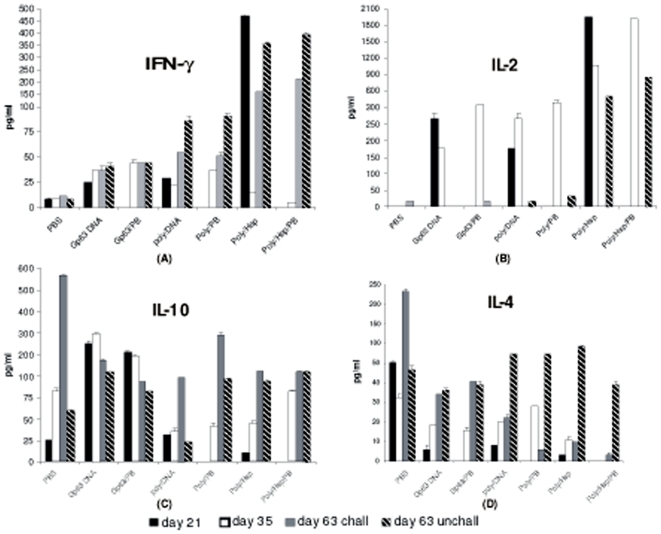
Figure 4. IFN-γ, IL-2, IL-4 and IL-10 production on day 21, day 35 and day 63 in all the vaccinated and control groups (6 mice per group) as shown in Fig. 2.
Culture supernatants were collected and the cytokines were assayed by flow cytometry. Results presented represent the mean ± SD (vertical lines on bars) of the triplicate assays.

