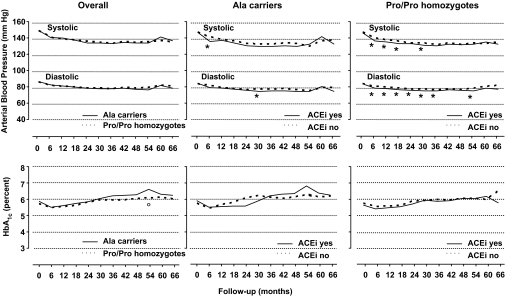
FIG. 3.
Upper panels: Trough systolic and diastolic blood pressure throughout the study period in Ala carriers or Pro/Pro homozygotes (left), in Ala carriers according to ACE inhibitor therapy (ACEi) (yes or no) (middle), and in Pro/Pro homozygotes according to ACE inhibitor therapy (yes or no). *P < 0.05 (ACE inhibitor therapy yes vs. ACE inhibitor therapy no, without Bonferroni correction for multiple comparisons). Lower panels: A1C throughout the study period in Ala carriers or Pro/Pro homozygotes (left), in Ala carriers according to ACE inhibitor therapy (yes or no) (middle), and in Pro/Pro homozygotes according to ACE inhibitor therapy (yes or no). °P < 0.05 (Pro/Pro homozygotes vs. Ala carriers, without Bonferroni correction for multiple comparisons).

