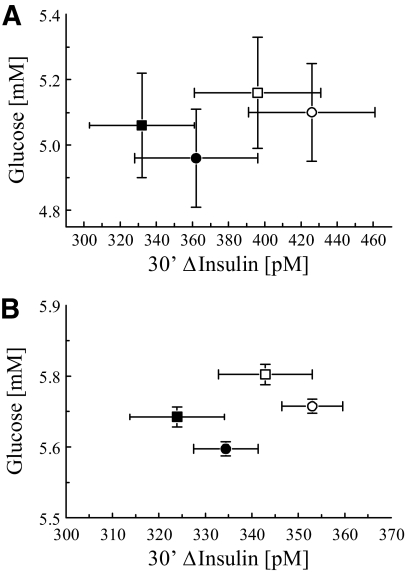
FIG. 3.
The 30′ Δinsulin vs. fasting plasma glucose stratified by GCK rs1799884 and G6PC2 rs560887 genotype. A: Shows results from the BetaGene Study. Model-predicted age- and sex-adjusted 30′ Δinsulin (means ± SD) stratified by genotype is plotted against model- predicted age- and sex-adjusted fasting plasma glucose (means ± SD). Solid symbols represent G6PC2 rs560887 G/A or A/A genotypes and open symbols represent G6PC2 rs560887 G/G genotype. Circles represent GCK rs1799884 G/G genotype and squares represent GCK rs1799884 G/A and A/A genotypes. B: Shows results from the METSIM Study. Details are identical to that described for the top panel except that circles and squares represent GCK rs4607517 genotypes.

