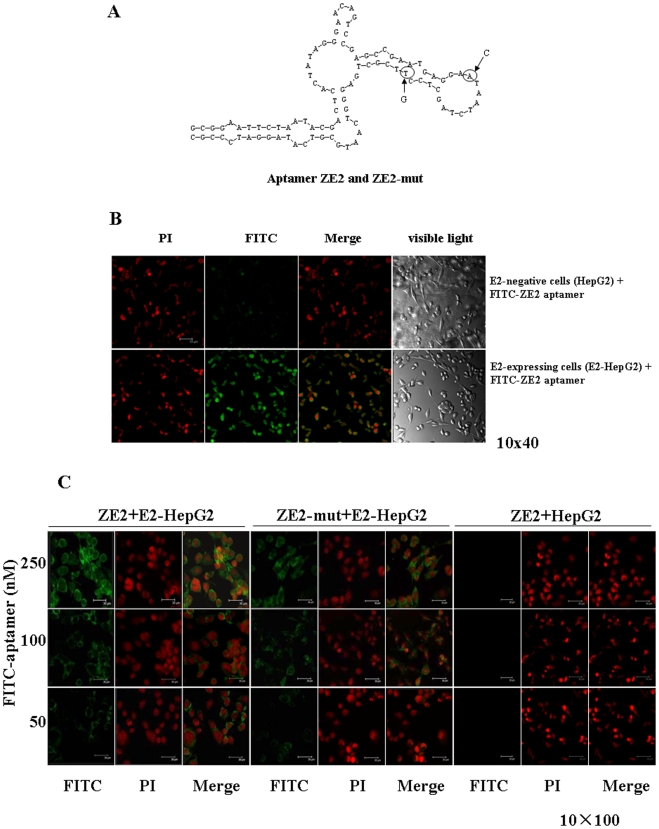
Figure 3. The characterization of aptamer ZE2 specificity for E2-expressing cells.
(A) Prediction of ZE2 secondary structure. Arrows represent exchanged bases in ZE2-mut compared to that of the ZE2 aptamer. (B) Fluorescence microscope imaging of E2-expressing cells with FITC-ZE2. FITC-ZE2 bound to E2-HepG2 cells but not to HepG2 cells by confocal immunofluorescence microscopy. (C) Comparison of different doses of FITC-ZE2 or FITC-ZE2-mut binding to the E2-HepG2 or HepG2 cells by confocal immunofluorescence microscopy.

