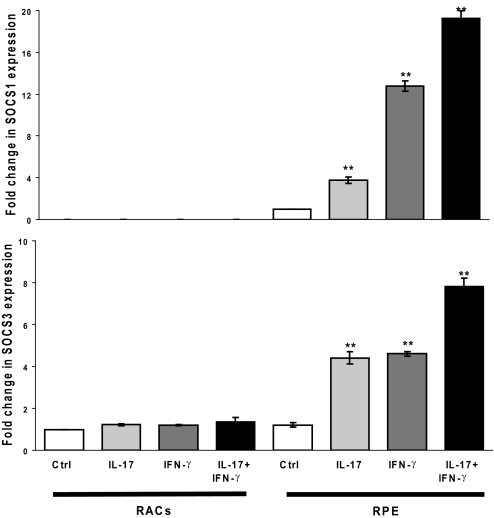
Figure 5.
SOCS-1 and SOCS-3 expression following IL-17 treatment of RACs and RPE cells. RACs and RPE cells were cultured to confluency and then treated with medium alone or 100 ng/ml IL-17 and/or 500 U/ml IFN-γ for 6 h or 24 h. Then, SOCS-1 and SOCS-3 mRNAs were measured by RT-PCR. The data shown are after treatment for 6 h; similar results were obtained after treatment for 24 h. **, P < 0.01.

