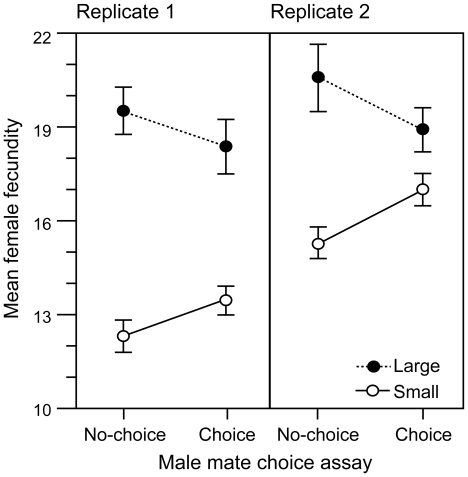
Figure 5. Effects of male mate persistence and choice on female fecundity.
Interaction plots comparing mean (±SE) fecundities (number of eggs produced) of large (closed circles) and small (open circles) females from the two replicates of the mate choice and no-choice assays (described in legend of Figure 4).

