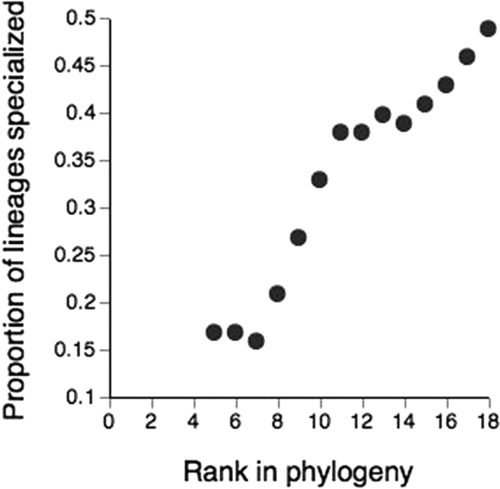
Fig. 4.
Distribution of specialization over the phylogeny of AWT vertebrates. The proportion of lineages composed of specialists is shown from the root (rank 0) to the tips of the phylogeny. Species were classified as specialists if they were above the median value of the specialization index used in Figs. 1 and 2. “Rank” refers to the number of branch points away from the root and was used as the metric for the analysis because we did not have information on branch lengths or a time scale.

