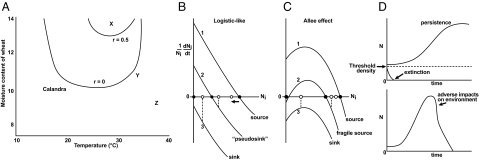
Fig. 1.
The niche and population dynamics. (A) Experimental niche model for a beetle, Calandra oryzae (L): intrinsic growth rate at different temperature and moisture values (9). The isopleth r = 0 defines the niche boundary. Site X is in the niche; sites Y and Z are not. (B) Per-capita growth rate at three locations along a gradient, expressed as functions of local density. Growth is logistic; without movement, maximal growth rate is at n = 0, and equilibrium is at carrying capacity K (black dots). Sites 1 and 2 are within the range; site 3 is outside of the range. Adding constant dispersal shifts local abundances toward the white dots; high-K sites are lowered (site 1); low-K sites (e.g., site 2) are raised above K (growth rate is negative; such sites are called “pseudosinks”); and sites (e.g., site 3) outside the niche sustain sink populations. (C) Allee effects along gradient. At low N, per-capita growth rate increases with N (this could be direct density dependence or indirect density dependence with short time lags). Site 2 has a positive, locally stable equilibrium; a population can persist even if it cannot increase when rare. Site 2 is within the population persistence niche, but outside of the establishment niche. (D) (Upper) Alternative local dynamics with Allee effects. (Lower) Local dynamics given niche destruction.

