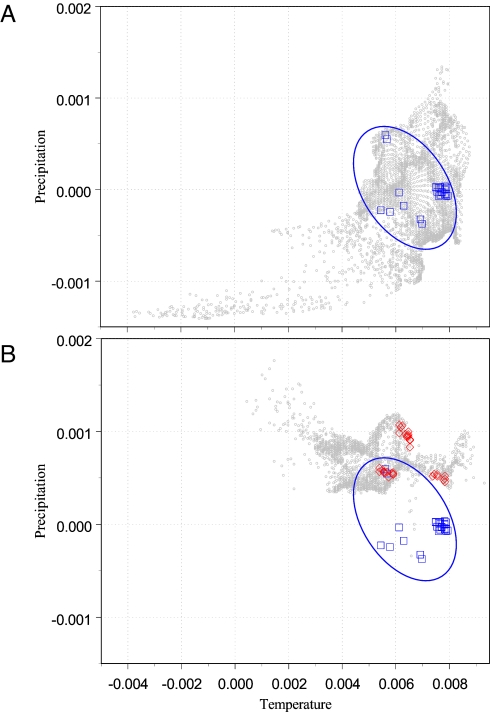
Fig. 3.
The same niche in two regions of E-space. (A) A subset of E-space is shown in light gray. The two dimensions are standardized mean annual temperature and annual precipitation, centered on the Argentine region where the moth C. cactorum occurs. The blue squares are reported occurrences of C. cactorum. The blue ellipse is a hypothetical representation of the FN of C. cactorum. (B) Another subset of the same E-space, now centered on the region of northern Florida that C. cactorum has invaded in the last 10 years. The units and the scale of A and B are the same. The hypothetical FN is placed exactly in its original Argentine position. The red diamonds are reported occurrences of C. cactorum in Florida. It is apparent that the structure of the E-space in the two regions is very different. C. cactorum in Florida occupies regions of similar temperature but higher precipitation than in Argentine. Whether this difference reflects different availability of climates or a true evolution in the FN of the moth cannot be determined with the available data.

