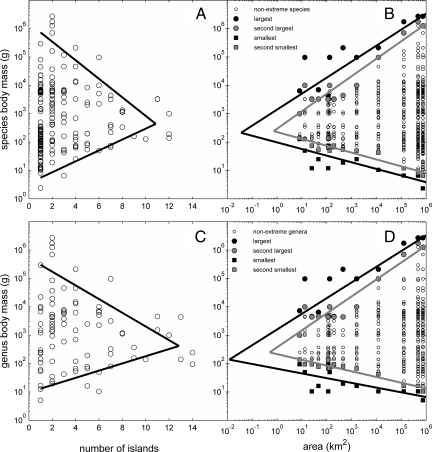
Fig. 4.
Body size–incidence and body size–area relationships for mammals on the Sunda Shelf islands. (A and C) Size–incidence relationship: body mass of species and genera as functions of number of island occurrences. (B and D) Size–area relationships: body mass of species and genera as functions of island area. The bold lines are regression fits to the maximum and minimum body masses of species or genera having a given number of island occurrences (A and C) or of species or genera found on each island (B and D). The gray lines are regression fits to the second-largest and smallest body masses on each island (B and D). Note that with increasing incidence and decreasing area the body size distributions converge toward an intermediate body size in the range of 122 to 454 g.

