
Figure 3.
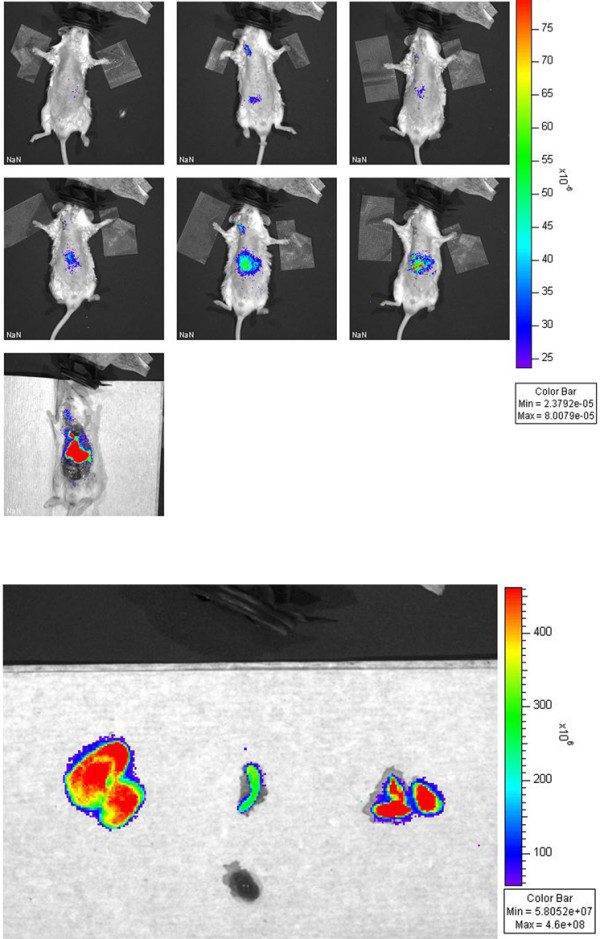
(a) In vivo optical imaging of a control FVB/n mouse after intravenous injection of DiD-labeled monocytes. Top row, left to right: pre-injection, 1 hour, and 2 hours post-injection. Middle row, left to right: 6 hours, 12, and 24 hours post injection. Bottom image: post-mortem dissection. (b) Removed organs 24 hours post injection. Left to right: Liver, spleen, lungs, heart. Images are representative of the FVB/n control mice injected with DiD-labeled monocytes.