
Figure 4.
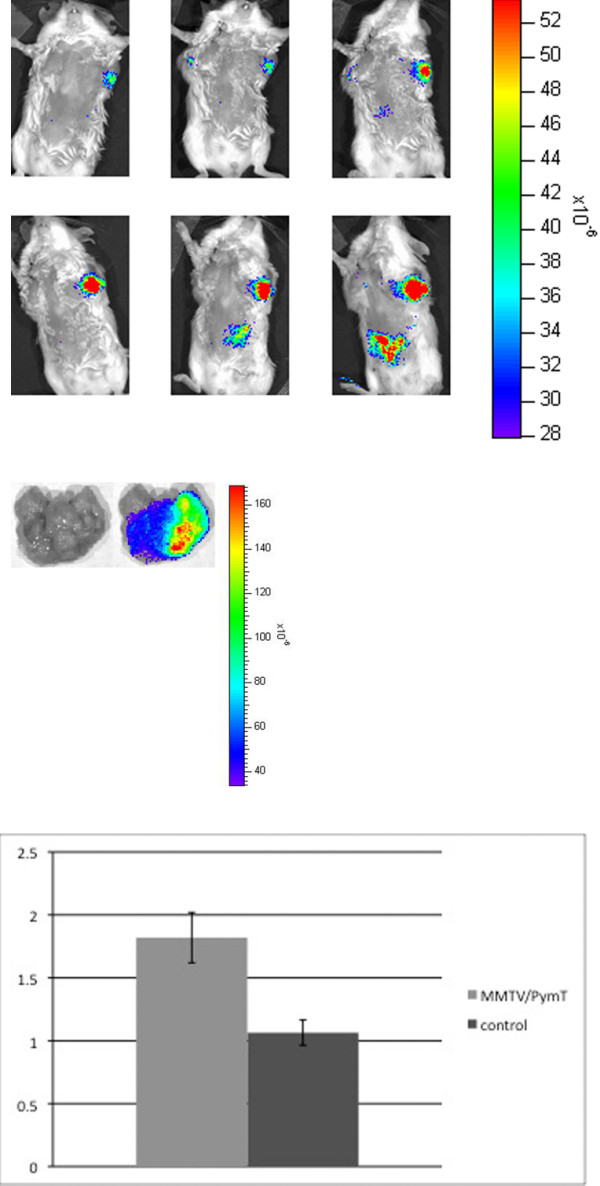
(a) In vivo optical imaging of a MMTV-PymT mouse after intravenous injection of DiD-labeled monocytes. Top row, left to right: pre-injection, 1 hour, 2 hours post-injection. Bottom row, left to right: 6 hours, 12 hours, 24 hours post-injection. (b) Optical imaging of explanted left axillary tumor from the same mouse. Left to right: photograph only, fluorescence image. Images are representative of the MMTV-PymT mice injected with DiD-labeled monocytes. (c) Quantitative analysis of fluorescence from breast tumors following injection of DiD-labeled monocytes. The left bar represents the average SI post/pre fluorescence ratio within breast tumors from MMTV-PymT mice, while the right bar represents the average SI post/pre fluorescence ratio within mammary tissue from FVB/n controls. Y-axis: average SI post/pre fluorescence ratio. Error bars represent the standard error of the mean. The difference between the two ratios was statistically significant, with a p-value less than 0.05.