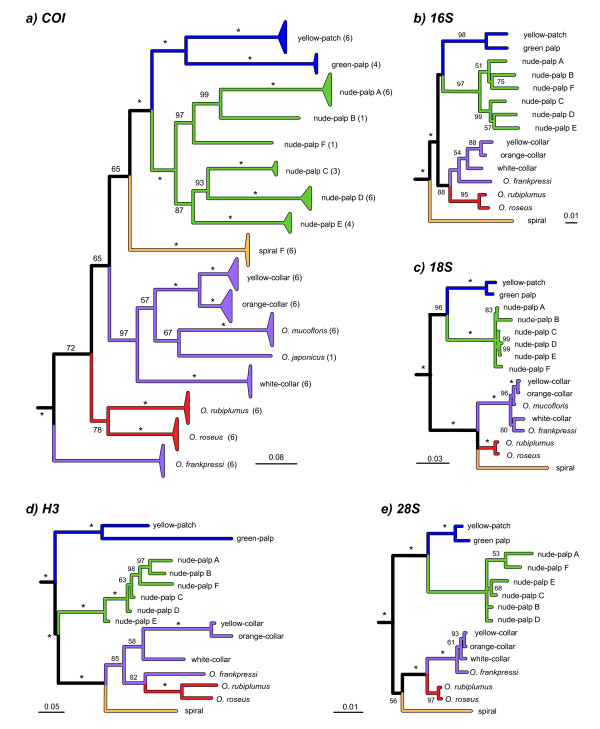
Figure 2.
Bayesian phylogenetic analyses of Osedax OTUs for portions of five genes: (a) mitochondrial COI; (b) 16S rRNA; (c) 18S rRNA; (d) Histone-H3; and (e)28S rRNA. The black triangles in a represent the maximum depth and breadth of sequence diversity observed among multiple individuals (sample sizes in parentheses following OTU designations). The small numerals represent Bayesian Posterior Probabilities (BPP) expressed as percent, * = 100.

