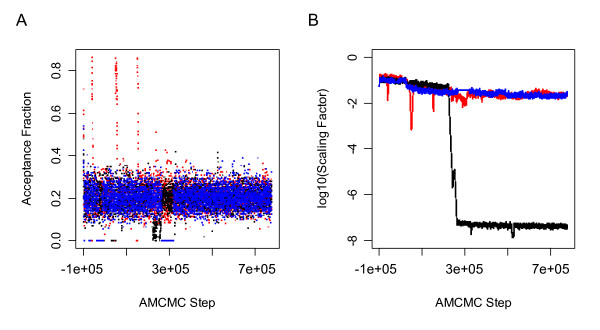
Figure 2.
Evolution in the proposal covariance scaling factor and the acceptance fraction as a function of AMCMC step. The proposal density is scaled dynamically to achieve an acceptance fraction of 0.2. (A) The trace of the acceptance fraction is shown as a function of AMCMC step. (B) The trace of the covariance scaling factor is shown as a function of AMCMC step. The results for each of the three parallel chains are shown in different colors: Chain 1 (Blue), Chain 2 (Black), and Chain 3 (Red).

