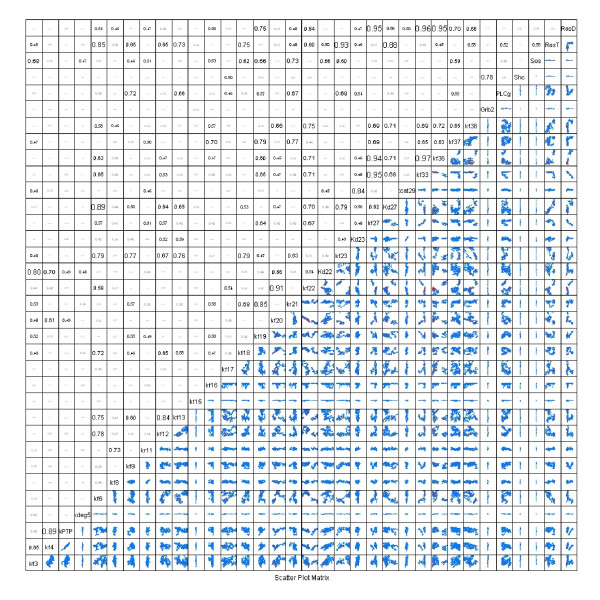
Figure 7.
Covariance structure of P(Θ| Y). The pairwise correlation coefficients of the parameters derived from all three thinned (Kthin = 200) Markov chains are shown above the diagonal. A high value for the correlation coefficient suggests that the parameters are unidentifiable given the calibration data. Below the diagonal, pairwise projections of the marginalized probability density for P(Θ|Y) are shown. The parameter names are shown on the diagonal. Each scatter plot axis spans a range of 1012 (i.e., (log - mean - 6.0 to log - mean + 6.0). The values in each scatter plot are centered at the log-mean values (i.e., the expectation maximum) determined from three parallel Markov Chains each containing 800,000 MCMC steps.

