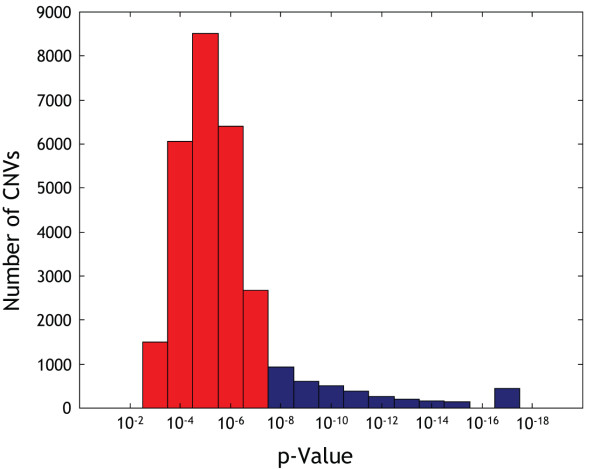
Figure 3.
P-value distribution of apparent CNVs detected by SMD in 462 samples from 154 ID trios. Data are from the analysis performed by 500 K GeneChip® AGH. Some of these apparent CNVs were merged into larger CNVs at a later stage of the analysis, but most represent individual aberrations. Apparent CNVs with p-values less than 1 × 10⁻⁸ were analysed further to determine if they were inherited or had occurred de novo. 4577 apparent CNVs were found with p-values below this threshold (shown in blue in the figure). The bin plotted at 10-17 actually contains all CNVs with p < 10-16, which is the lower limit of the tables used to calculate p-values.

