Fig. 2.
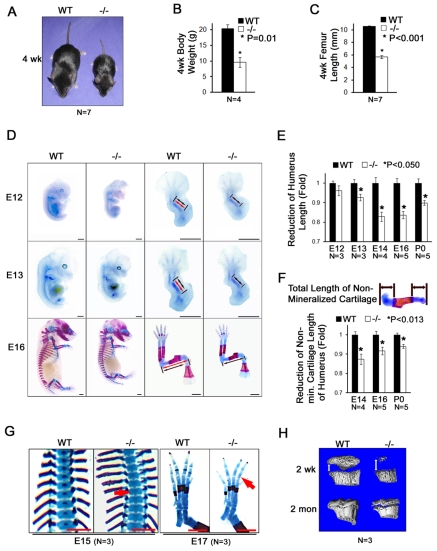
Atf4−/− embryos and mice exhibit dwarfism. (A) One-month-old WT and Atf4−/− mice. (B) Quantification of body weight of 1-month-old WT and Atf4−/− mice. Error bars indicate s.e.m.; n=4 mice of each genotype. P=0.01 by paired Student's t-test. (C) Quantification of femur length of 1-month-old WT and Atf4−/− mice. (D) Alizarin Red S and Alcian Blue stained skeletons of embryos and limbs at E12 (12 dpc), E13 and E16. Red and black double-headed arrows represent the length of WT and Atf4−/− humeri, respectively. (E) Quantification of humerus length during development for WT and Atf4−/− mice. Error bars indicate s.e.m. of Atf4−/− humerus length normalized to WT humerus length. (F) Quantification of non-mineralized cartilage length (top panel, double-headed arrows) in WT and Atf4−/− humerus during development. Error bars indicate s.e.m. of Atf4−/− normalized to WT humerus non-hypertrophic zone length. (G) Alizarin Red S and Alcian Blue stained skeletons of embryos showing a delay in the formation of the primary ossification center in E15 Atf4−/− thoracic vertebrae (left, arrow) and E17 hindlimb digits (right, arrow). (H) Microtomographic image showing a delay in formation of the secondary ossification center in Atf4−/− mice (as indicated by the double-headed arrow). Scale bars: 1 mm.

