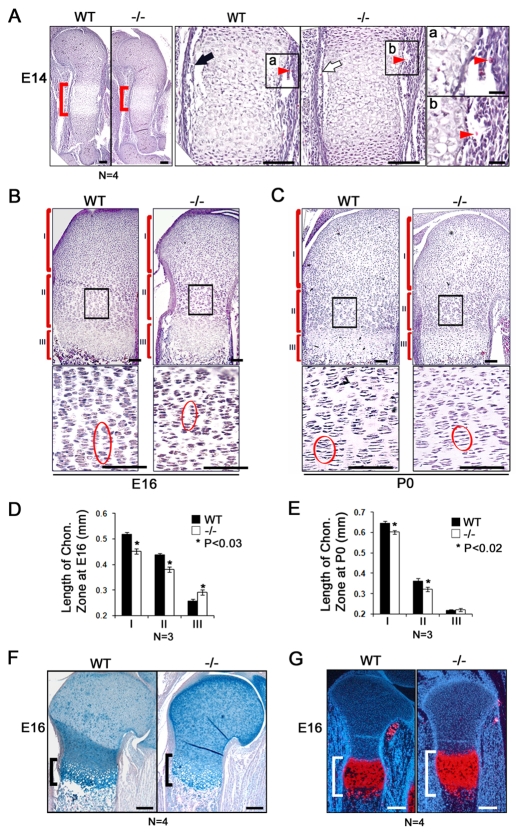
Fig. 3.
Decreased proliferation zone and expanded hypertrophic zone of Atf4−/− growth plate chondrocytes. (A) Hematoxylin and Eosin (H&E) staining of sections through E14 WT and Atf4−/− mouse humerus. The center of the humeri (red brackets) are magnified in the middle pair of panels. The black arrow indicates newly formed cortical bone in the WT humerus, which is much thinner in the Atf4−/− humerus (white arrow). (a,b) Higher magnification of the boxed regions of the humerus center showing vascular invasion (arrowheads) in WT and Atf4−/− humeri. (B,C) H&E staining of E16 and P0 WT and Atf4−/− humerus sections. Reserve (I), proliferative (II) and hypertrophic (III) chondrocyte zones are indicated. Boxed regions showing proliferating chondrocytes are magnified beneath. The pattern of well-aligned columnar chondrocytes in the E16 WT proliferating zone is completely disorganized in the Atf4−/− growth plate (circled). (D,E) Quantification of the length of the different chondrocyte zones. Error bars indicate s.e.m. In E, P=0.1 for III. Statistical analysis was performed by paired Student's t-test. (F) Alizarin Red and Alcian Blue staining of growth plates of the radius showing that the hypertrophic zone (bracket) in Atf4−/− growth plates is expanded compared with its WT littermates at E16. (G) In situ hybridization showing that the zone of Col10a1-expressing chondrocytes (red) is increased compared with WT control. Scale bars: 0.1 mm in A; 0.02 mm in Aa,b; 0.2 mm in F,G.

