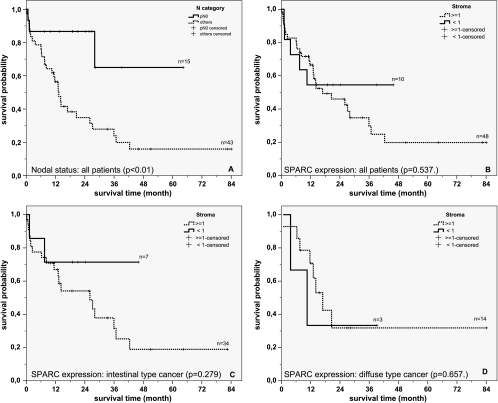
Figure 4.
Overall survival. Kaplan-Meier curves depicting overall patient survival according to nodal status (A; P = .010), expression of SPARC (<1 vs ≥1) in cells of the desmoplastic stroma in all patients (B; P = .537), patients with intestinal-type gastric cancer (C; P = .279) and patients with diffuse-type gastric cancer (D; P = .657).

