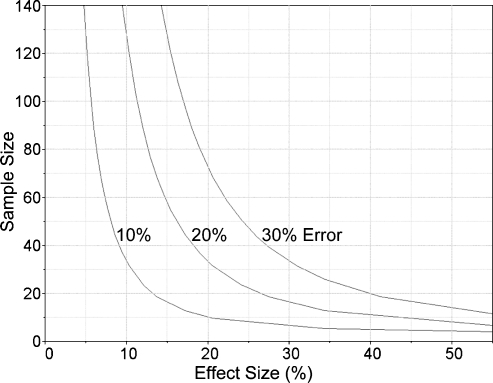
Figure 6.
Illustration of sample size versus minimum expected effect size for different total noise in measurements for a test power of 80% and significance level (α) = 0.05 (adapted from Doot et al. [47]). Total noise includes, for example, biologic, local calibration, and multicenter measurement effects.

