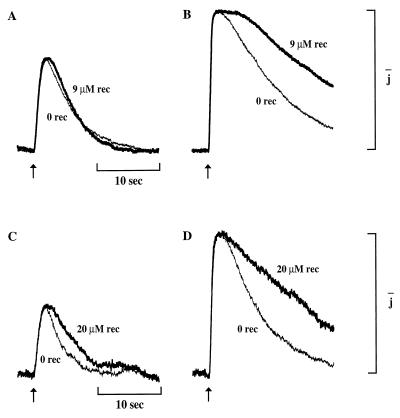
Figure 4.
Dependence of the effect of Ca-recoverin on flash strength. (A) Half-saturating responses to dim flashes (185 photons/μm2). Response in 9 μM Ca-recoverin (bold trace) and subsequent response in 0 μM Ca-recoverin (thin trace). Time constants, τ, were (s): 4, recoverin; 4, control. Absolute amplitudes (pA): 30, recoverin; 31, control. For comparison, the subsaturating control and Ca-recoverin responses have been scaled to the same amplitude and expressed relative to the saturating control response amplitude. (B) Saturating responses of the cell of A to brighter flashes (894 photons/μm2). Response in 9 μM Ca-recoverin (bold trace) and subsequent response in 0 μM Ca-recoverin (thin trace). Time constants, τ, were (s): 13.3, recoverin; 10.4, control. Absolute amplitudes were (pA): 54, recoverin; 47, control. For A and B, control solution contained 0 μM recoverin and 0.5 μM Ca, recoverin solution contained 8.6 μM C14:2 recoverin and 30 μM Ca. (C) Half-saturating responses from a different outer segment to dim flashes (8 photons/μm2) at a higher concentration of Ca-recoverin (20 μM, bold trace). Subsequent response in 0 μM Ca-recoverin (thin trace). Time constants, τ, were (s): 2.9, control; 4.6, recoverin. Absolute amplitudes were (pA): 13, control; 11, recoverin, and the responses have been scaled as in A. (D) Saturating responses of cell of C to brighter flashes (42 photons/μm2) with Ca-recoverin (20 μM, bold trace). Subsequent response in 0 μM Ca-recoverin (thin trace). Time constants, τ, were (s): 6.3, control; 21, recoverin. Absolute amplitudes were (pA): 27, control; 18, recoverin. For C and D, control solution contained 0 μM recoverin and 0.5 μM Ca, recoverin solution contained 20 μM myristoylated recoverin and 30 μM Ca.

