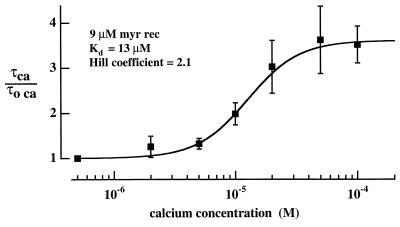
Figure 6.
Ca dependence of response prolongation by myristoylated recoverin. Prolongation factor, τhigh Ca-recoverin/τ0.5 μM Ca, for flash response plotted as a function of the high Ca concentration (log scale). Collected results from saturating responses of 14 cells with 8.6 μM myristoylated recoverin, points are means of at least four measurements; error bars indicate SEM. Continuous curve drawn according to the Hill equation with parameters determined by weighted least squares fit: Kd 13 ± 4 μM (SD), Hill coefficient was 2.1 ± 0.7. The point at 0.5 μM Ca was taken as equal to 1 and assigned a weight consistent with the highest SEM.

