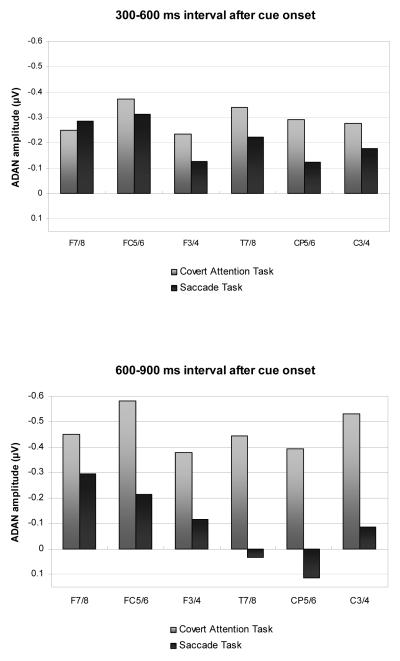
Figure 4.
Size of ADAN component at anterior and central electrode pairs in the 300-600 ms time interval after cue onset (top panel), and in the subsequent 600-900 ms time interval (bottom panel), shown separately for the Covert Attention task (grey bars) and the Saccade task (black bars). Amplitude values were obtained by subtracting ERP mean amplitudes at electrodes ipsilateral to the cued side from mean amplitudes obtained at the corresponding contralateral electrodes.

