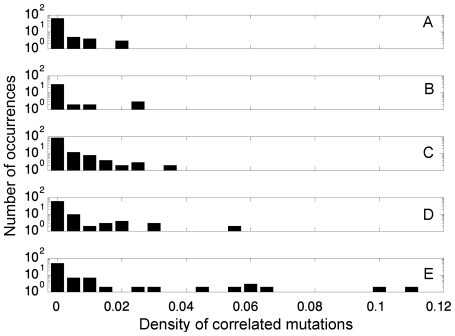
Figure 5. Distributions of correlated mutation densities in the case of the five different sets of real proteins examined in this study.
The densities of correlated mutations were calculated for the sets of control proteins (A), classes I (B), II (C) and III (D) of the GroEL-interacting proteins and the intrinsically unstructured proteins (E). It can be seen that the density of correlated mutations of these sets increases with the increasing likelihood that their average ‘contact-frequency’ has increased.

