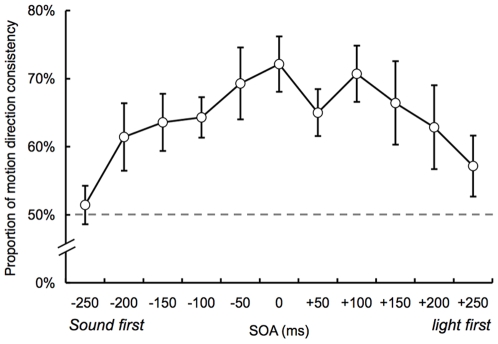
Figure 4. Results of Experiment 3 with the manipulation of SOA (N = 7).
The vertical axis denotes the proportion that the perceived motion direction of the visual stimuli was consistent with the alternate direction of the sounds between the ears. While negative SOAs indicate that the auditory stimuli were presented earlier than the visual stimuli, the visual stimuli were presented earlier than the auditory stimuli in positive SOAs. Error bar denotes the standard error of the mean.

