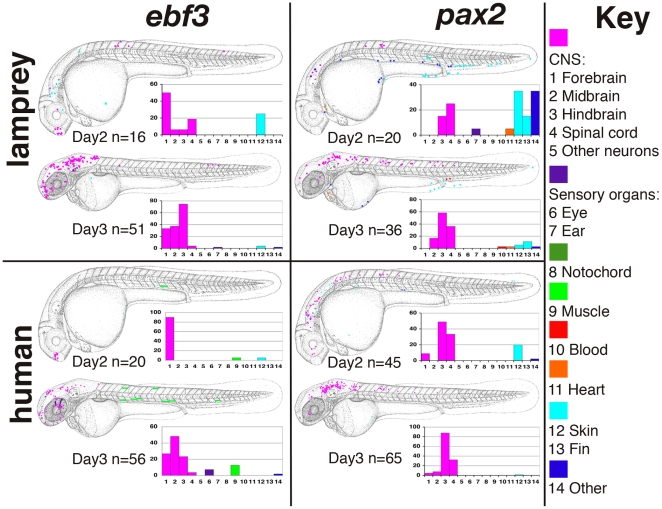
Figure 2. Schematic representations of GFP expression patterns driven by core CNEs.
GFP-positive cells are marked onto camera lucida drawings of a zebrafish embryo on day 2 (24–30hpf) and day 3 (48–54hpf) of embryonic development. At each stage, the results are collated from all embryos with expression and overlaid to give a composite depiction of the GFP expression pattern. The number of GFP-positive embryos are noted under each schematic (n = ). The charts show the percentage (y axis) of GFP positive embryos with expression in each domain 1–14 (see below). In both the charts and the schematics, broad domain categories are colour coded. 1, forebrain; 2, midbrain; 3, hindbrain; 4, spinal cord; 5, other neurons (CNS, pink); 6, eye; 7, ear (sensory organs, purple); 8, notochord (dark green); 9, muscle (light green); 10, blood (red); 11, heart/pericardium (orange); 12, epidermal; 13, fin (both light blue); 14, other (dark blue).

