
Figure 1.
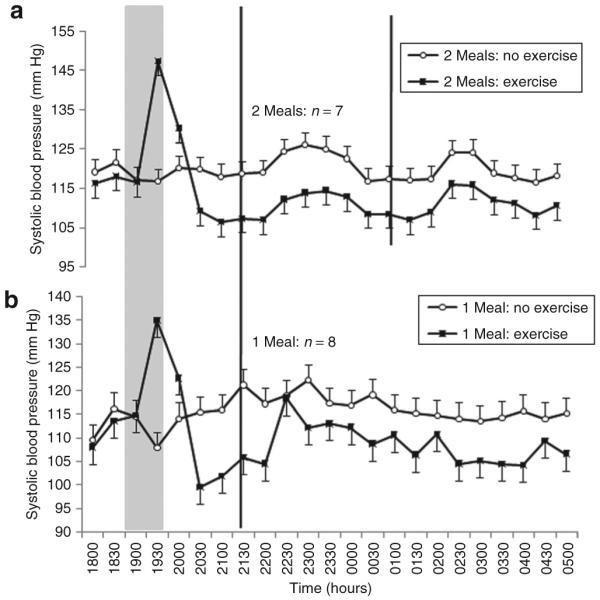
Mean ± s.e. systolic blood pressure measured every 30 min during a simulated night-shift with, and without, exercise prior to the beginning of the shift. (a) Consumption of two smaller (30 kJ/kg body mass) meals during the shift at 2200 and 0200 hours. (b) Consumption of one larger (60 kJ/kg body mass) meal during the shift at 2200 hours. The gray panel indicates time of exercise or rest. Black vertical lines indicate time of meal consumption.