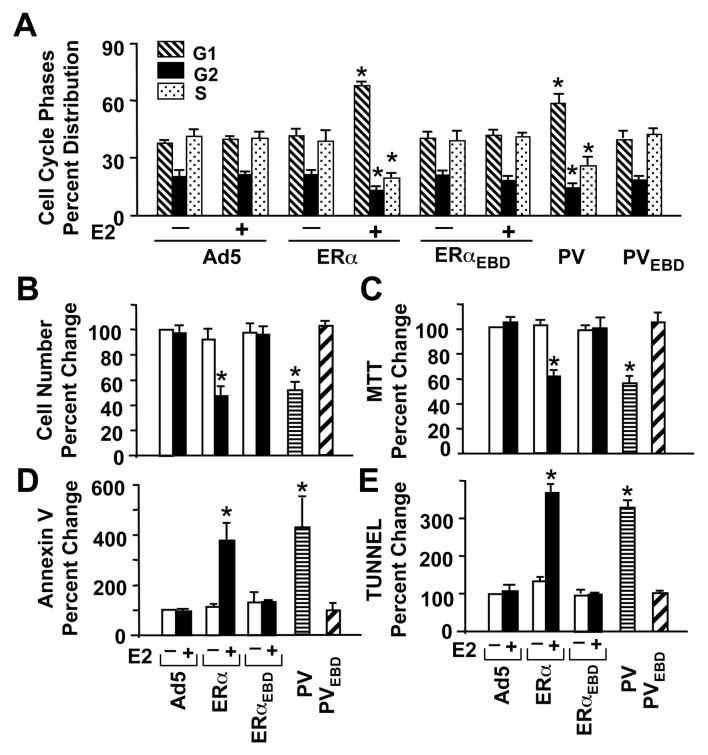
Fig. 3.
Effects of monotransregulators on cellular growth. (A) MDA-MB-231 cells infected with recombinant adenoviruses in the presence (+) or absence (−) of 10−9 M E2 for 48h were subjected to fluorescence-activated cell sorting for the cell cycle analysis. Results depicted as the percent of cells in G1, G2 and S phases are the mean ± s.e.m. of three independent experiments. (B & C) Infected cells maintained in the presence (+) or absence (−) of 10−9 M E2 (E2) for six days were subjected to (B) cell counting or (C) MTT assay. The mean ± s.e.m., which depicts three independent experiments performed in duplicate, indicates percent (%) change in cell number compared to those observed in cells infected with Ad5 in the absence of E2, which is set to 100. (D & E) MDA-MB-231 cells were also subjected to (D) Annexin V and (E) TUNEL assays at 96h post-infection for the effects of proteins on cellular death. Results, which are the mean ± s.e.m. of three independent experiments, are summarized as percent (%) change in the number of cells bound to Annexin V or as the number of cells that incorporated fluorescein isothiocyanate-conjugated dUTP into the fragmented DNA (TUNEL) obtained in comparison with the cells infected with Ad5 in the absence of E2, which is set to 100. Asterisk (*) indicates significant change.

