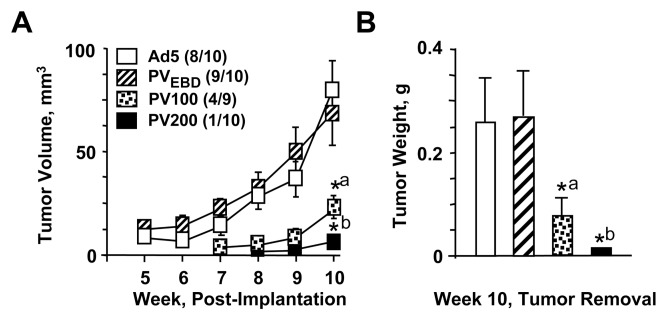
Fig. 6.
Effects of monotransregulators on tumor growth in xenografts. MDA-MB-231 cells were infected with Ad5 or Ad5-PVEBD at 900 MOI for 48h. A group of cells was also infected with Ad5-PV at 100 or 200 MOI supplemented with 800 or 700 MOI of Ad5, respectively. Infected cell suspensions (4×10⁶ cells/mouse) were subcutaneously inoculated into the left mammary fat pads of female athymic NCr-nu/nu mice (ten mice/group, with the exception of the Ad5-PV-100 group that contained nine mice). (A) The tumor size was measured with calipers weekly and the tumor volume was calculated. Tumor incidence for each group is shown in parenthesis. Points denote the mean ± s.e.m. of tumor volume of each group. *a denotes significant change (P<0.041) compared to Ad5. *b indicates significant change (P<0.0161) compared to Ad5. (B) At week ten mice were sacrificed. Tumors were removed and weighed. Bars are the mean ± s.e.m. of tumor weight from each group. *a denotes significant change (P<0.008) compared to Ad5. *b indicates significant change (P<0.001) compared to Ad5.

