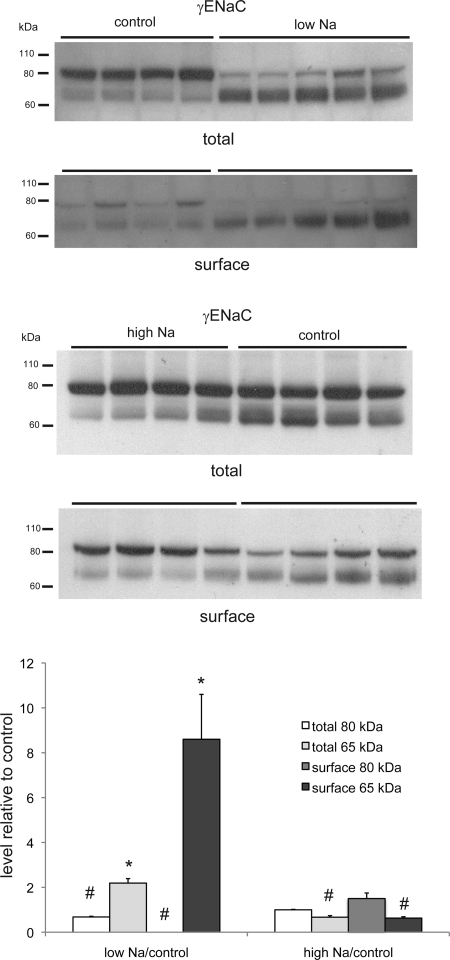
Fig. 2.
γ-ENaC protein in total and surface membrane fractions of the kidney of rats fed control-, low-, or high-Na diet. Each lane represents a different animal. Lanes were loaded with 75 μg (low-Na vs. control) or 60 μg (high-Na vs. control) of total membrane protein or NeutrAvidin eluate from 600 μg of total membrane protein. Densities of bands were normalized to those of control samples. *P < 0.05 (experimental > control). #P < 0.05 (experimental < control).

