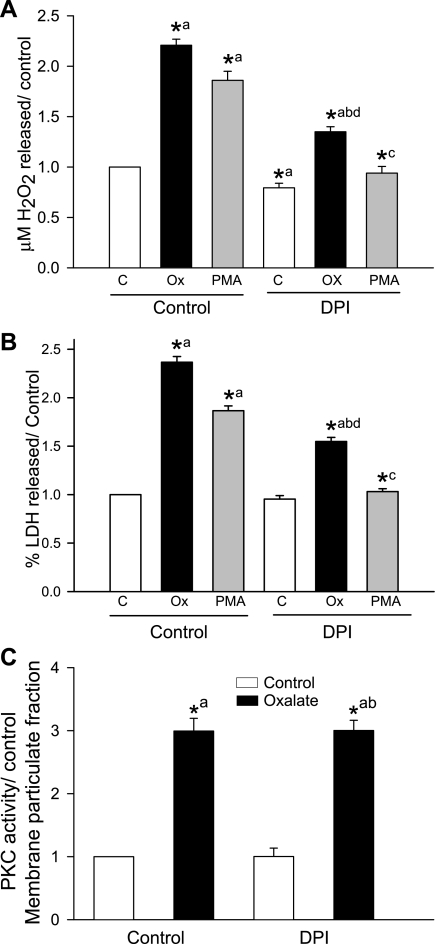
Fig. 10.
Effect of the NADPH oxidase inhibitor DPI on oxalate- or PMA-induced H2O2 production, LDH release, and PKC activity. A and B: LLC-PK1 cells were pretreated with 0.5 μM DPI for 30 min and then exposed to 0.75 mM oxalate or 1 μM PMA along with DPI for 3 h, after which H2O2 production (A) and LDH release (B) were determined. DMSO was used as a vehicle. Data are normalized to control, and values are expressed as means ± SE. Comparisons shown: a, significant compared with control; b, significant compared with oxalate-treated; c, significant compared with PMA-treated; d, significant compared with DPI-treated control.*P < 0.05; n = 6. C: effect of DPI on oxalate-induced PKC activity in the membrane fraction. LLC-PK1 cells were pretreated with 0.5 μM DPI for 30 min and then exposed to 0.75 mM oxalate along with DPI for 3 h, after which PKC activity was measured. DMSO was used as a vehicle. Data are normalized to control, and values are expressed as means ± SE. Comparisons shown: a, significant compared with control; b, significant compared with DPI-treated control. *P < 0.05; n = 3.

