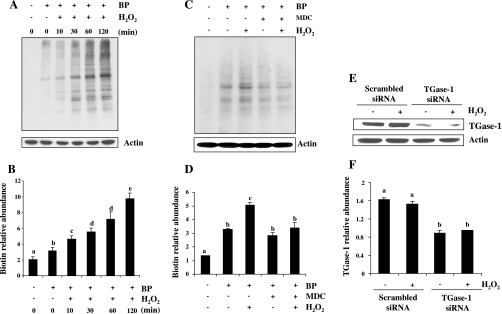
Fig. 2.
Inhibition of TGase activity by MDC and downregulation of TGase-1 by siRNA in cultured RPTC following H2O2 exposure. RPTC were incubated with 1 mM 5-(biotinamido)pentylamine (BP) for 1 h and then treated with 1 mM of H2O2 for indicated time (A) or 30 min (C) in the presence or absence of MDC (100 μM). Cells were harvested for analysis of TGase transamidation activity as described in materials and methods. A and C: representative blots for TGase activity from 3 independent experiments. B and D: biotin-labeled proteins in A and C were quantified by densitometry and normalized to actin. RPTC were transfected with scrambled siRNA or TGase-1-specific siRNA. At 12 h after transfection, cells were starved for an additional 24 h and then treated with 1 mM H2O2 for 30 min (E and F). Cell lysates were prepared and subjected to immunoblot analysis with antibodies for TGase-1 and actin (E). The level of TGase-1 was quantified by densitometry and normalized to actin level (F). Values are means ± SD of 3 independent experiments. Bars with different letters are significantly different from one another (P < 0.05).

