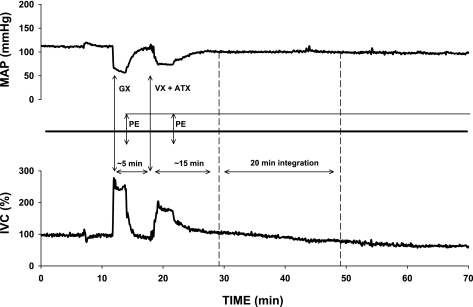
Fig. 3.
An example of time control experiment following ADX + GX + VX + ATX; no CPA was microinjected in this experiment. The dashed arrow denotes a potential microinjection of CPA and the subsequent 20-min integration of the response. Note that although the infusion of PE did not fully compensate for the decrease in mean arterial pressure (MAP), the iliac vascular conductance (IVC) gradually declined constricting iliac vasculature slightly below the baseline level.

