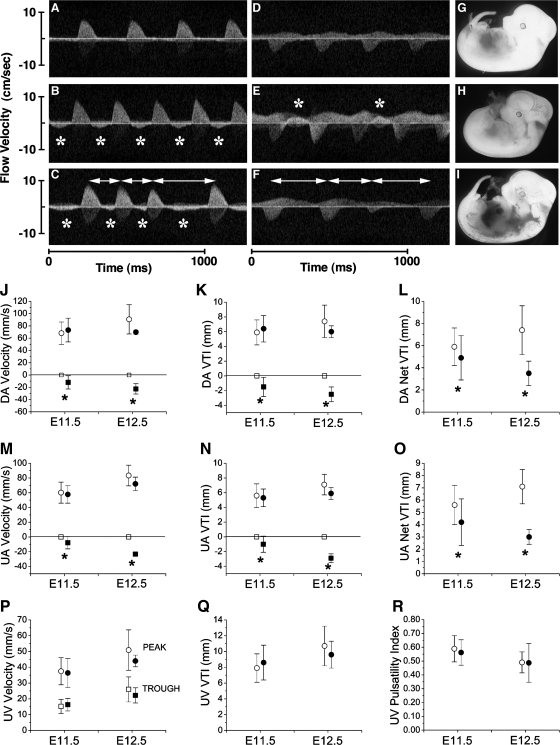
Fig. 4.
Blood circulation is abnormal in the mutant. Representative Doppler profiles of blood flow in the dorsal aorta (DA; A–C) and umbilical artery (UA; D–F) at E11.5 are shown. Data are means ± SD. *Reversed arterial flow. Double arrows are cardiac arrhythmia. These embryos were serially imaged at E11.5 and E12.5 and harvested at E12.5 (G–I). A, D, and G: control. B, C, E, F, H, and I: mutant. J–O: summary of hemodynamic analyses. Peak Doppler blood flow velocity, velocity-time integral (VTI), and net VTI in DA and UA are shown as indicated. P: umbilical vein (UV) velocities [systolic (peak) and diastolic (trough)]. Q: UV VTI. R: UV pulsatility index = (systolic − diastolic)/systolic. ○ and □, control; ● and ■, mutant; ○ and ●, forward flow; □ and ■, reverse flow.*P < 0.01.

